

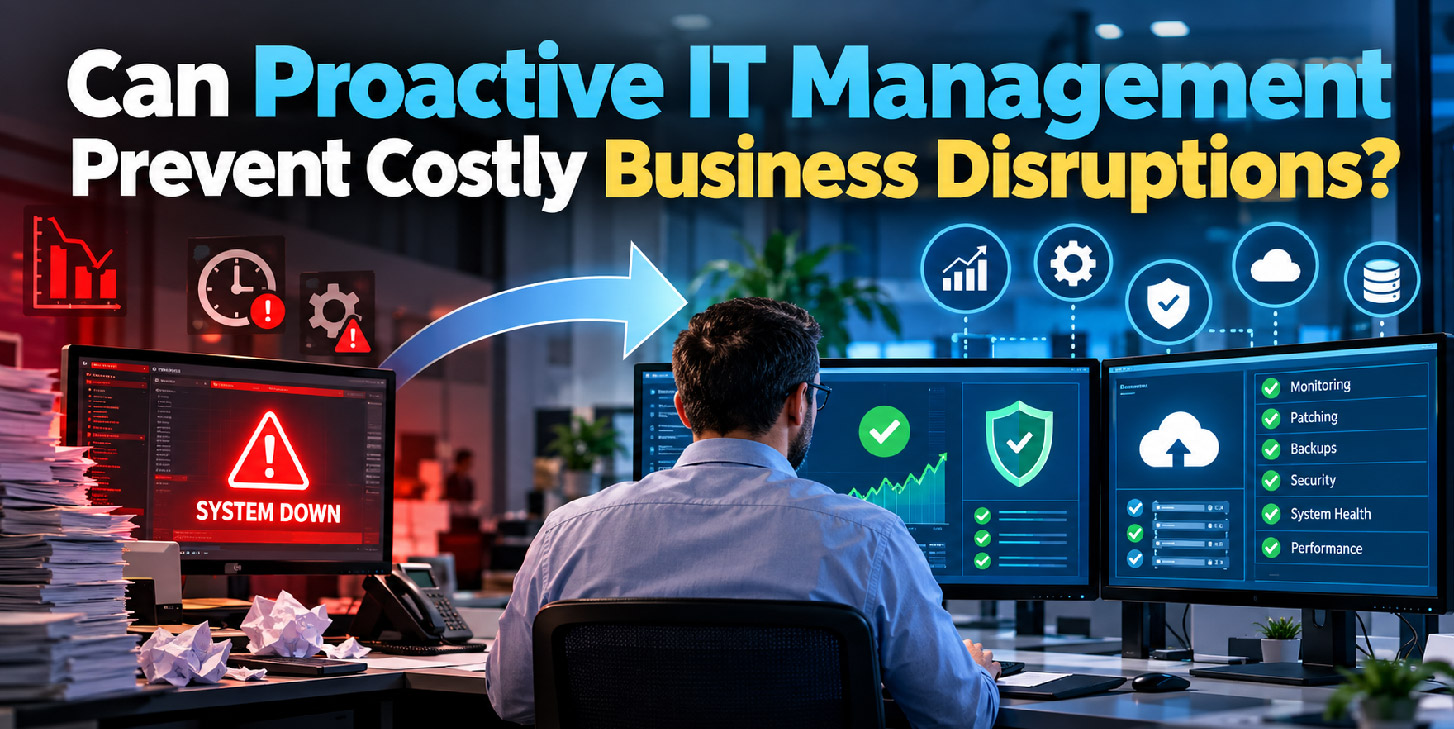
It’s easy to list out the differences between reactive support and proactive support for technology teams. However, few teams can actually provide data on specific practices they have implemented and the corresponding failure modes that were removed over the past year. This gap is critical because, like many things, prevention is only valuable when measured, scheduled, and someone owns it versus is an attitude.
Below, we explore in detail three crucial areas. First, we outline the scenarios in which proactive, preventive work fundamentally displaces reactive, response work and adds value. Next, we discuss a number of areas in which it does not. We then explore the appropriate structure to ensure the work is fundable and delivers the required value.
Where the money actually goes when systems fail
The costs of unplanned downtime are more than what is displayed on the face of an incident ticket. While the visible cost is made up of the engineer’s hours and the time lost whilst production is not running, the real cost is typically hidden away in deferred work in other departments, hasty and costly procurements, overtime working to clear the backlog of other work, and loss of credibility that means change will take longer to get approved in the future.
Separating incident cost from failure cost
Useful cost modelling, to help drive the best use of budget, looks to split each disruption into two costs, the cost of the disruption itself (the ‘visible cost’ as shown on the incident ticket), and the cost of the underlying deficiencies that led to the issue occurring in the first place (the ‘hidden cost’). The reactive team continually pays the visible cost, whilst the proactive team only pays the hidden cost once.
When presenting a business case, remember to forecast the recurrence of faults that have already failed on multiple occasions. A single occurrence might be a history item, but three failures within a year is a forecast.
Monitoring that forecasts instead of reporting
Thresholds let you know something has gone wrong. Trending gives you a warning of when something is going to go wrong. For example, a disk that is currently at 85% capacity is simply telling you the current state. A disk that is growing at a rate of 4% per week is telling you a date in the future on which it will fill up.
Choosing signals worth alerting on
While alert volume can often become a big problem for maintaining a good preventive management regime, all alerts are not created equal. Those that can be quickly remedied and for which there is a good lead time are far more valuable than those that cannot. Where nobody internally owns the daily triage of these signals, handing that watch to a provider of managed IT support in Sydney is usually a better outcome than letting the alerts accumulate unread.
- Capacity growth rates for storage, memory, licence counts and bandwidth.
- Hardware predictive indicators such as SMART warnings, battery health, fan and thermal faults.
- Failed or partially completed backup jobs, reported per protected workload rather than per server.
- Authentication anomalies, particularly impossible travel and repeated multi-factor denials.
- Certificate, domain and support contract expiry dates at 90, 30 and 7 days.
Patching and preventative maintenance as scheduled risk reduction
Most patching disputes occur because there is a disputed view on risk. Define patch latency targets for all asset classes and measure against them. Some asset classes will have tighter window constraints than others (e.g. Internet/Identity vs. Plant controller in a segregated environment). However, with appropriate compensating designs, some asset classes can be patched on a less frequent cycle (e.g. Quarterly).
Cadence, purpose and proof
As for maintenance, all your recurring maintenance should have a stated set of failure modes it prevents and you should be able to verify that it worked as intended. Usually it doesn’t.
| Activity | Typical cadence | Failure mode prevented | Evidence it is working |
| Operating system and third-party patching | Monthly, with out-of-band for critical flaws | Exploitation of known vulnerabilities | Patch latency by asset class, trending down |
| Firmware and driver updates | Quarterly | Storage, network and hypervisor instability | Reduction in unexplained reboots and resets |
| Capacity review | Monthly | Saturation outages and emergency purchasing | Forecast headroom of at least two quarters |
| Restore testing | Quarterly per critical workload | Recovery failure discovered during a live incident | Documented restore times against agreed targets |
| Access and privilege review | Half-yearly | Standing privilege misused after compromise | Count of accounts with unnecessary admin rights |
Backup and security as tested capabilities, not configurations
A backup policy in itself is mere intent to be successful. Completing a restore from backups actually grants a capability that prevents data loss in the future. The same logic is applied to security controls, a configured state of a control does not necessarily mean the same as effective state, as many exclusions are quietly added and even agents go out of date.
What a credible test looks like
- Recovery of a full workload to an isolated environment, not a single file spot-check.
- Timing measured end to end, including approvals and data validation by the business owner.
- At least one copy proven immutable or logically separated from production credentials.
- A documented result, with the gap between achieved and target recovery times acted on.
Ransomware attacks now specifically target backup systems first, therefore a recovery plan that relies on production directory services is of no value.
Building an operating rhythm that stays proactive
If the work cannot be protected in your organisation’s busy schedule, all should be outsourced under a fixed annual fee. Leave the architectural issues to the recipient organisation but mandate what to do with discovered issues. After two quarters of such scheduled work the organisation will have slid back into the classic pattern of firefighting.
Protecting the capacity
Ring-fence a proportion of the engineering resources to complete the preventive work on a scheduled basis. Account for this work in the same graphs as the reactive work. If needed, contract the work out to a managed IT support Sydney service and ensure that the in-house team retains architecture and vendor management skills.
You May Also Read: Can smarter printing workflows help reduce everyday office admin?
